

I recently hit 2,000 visitors. I consider this an achievement because I have been mainly blogging about two niche categories. The first is Epilepsy and the second is Test cricket. I am an analyst so I could not but help to dissect my numbers. The data available through the web browser is significantly better than that available through the app.
There are essentially three categories of data available. The first is Traffic. The second is Insights and the third is Ads. The Ads data is available for premium and business plans so that you can check how much money your site has generated.
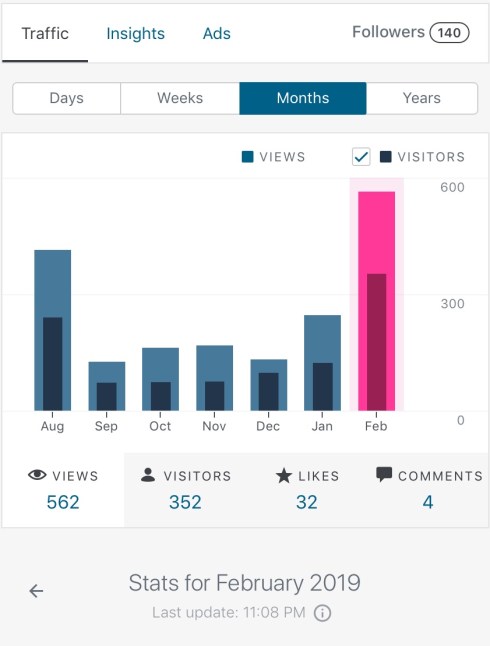
The information available under Traffic is your raw data. It shows you the views, visitors, likes and comments by day, week, month or year. Below is the data for my blog.
The Traffic tab also shows the number of views each post received, the search terms that led to people to your blog, the countries where your posts have been red and the sources from where people have viewed your post.
Insights show the postings and views throughout the year by month or day. It also shows the most popular day and most popular hour. Insights also show the views per tags and categories although I personally feel that this particular statistic can be slightly misleading. The annual site stats is extremely helpful. Below are my stats for 2019

I love performance measurements. The problem though is how to measure it appropriately. The first thing you should know is what is important for you. Do you want followers and does the rise or fall of them matter to you? Does it matter how many people visit your blog or could it be the views. Maybe it is the likes or comments? These may seem similar but they are different. All followers need not read your posts and vice versa.
What matters to me is how many people read my posts and what topics they read. I would like my viewership for my Cricket Portfolio Index to grow because that is a pet project of mine and it is something I believe in.
I would like my posts on Epilepsy to be read because I know that I will be bringing awareness to Epilepsy. I have started writing about investments. I want my investments posts to grow. The one area I would really like to grow is the comments on my blog.
Milly Schmidt wrote an interesting piece on her stats. This is an interesting read and gives a slightly different view to WordPress stats. As always I welcome your comments.

Thanks for this post. I am more or less new to the statistical side of WordPress and actually did not really know what to do with the statistics that I always get or how to read it. Your post made me open my side and take a look in detail and try to understand what the numbers etc mean. Thanks for explaining as some of it is very useful eg. most popular day and most popular hour for a post.
LikeLiked by 2 people
You are welcome!! I usually post depending on my audience. If it is to a U.K. time zone then I schedule a post for 10 or 11 am. If it is an international post then it will be about 3 pm U.K. time. If it is related to cricket then I post it in the time zone of where the game is played.
I like using views per post. I also keep a note of how my average words per post. If you have any other questions then do let me know.
LikeLiked by 2 people
Wow! I never thought of it like that! Thanks!
LikeLiked by 2 people