
This index is a long time coming. The main problem I have had is the scoring pattern has made it difficult for me to come up with a satisfactory algorithm. Is England that good or Australia that bad? I may not have an answer until the series against India starts in July. For the time being England completely dominate the numbers. My scoring graph currently looks like this

Australia did better than England’s first ODI but it has essentially been downhill since then. They are barely ahead of Scotland. Teams will have a lot of catching up to do to get to where England is or England will have to lose by that big a margin in the next few games.
The best batsmen, bowlers and players who scored the most points are below

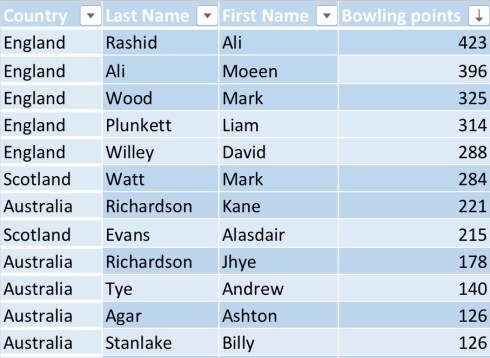

Two things stand out from these tables. The first is the dominance of England and the second is how well Scotland played. Unfortunately, Scotland is not playing an ODI for so the Scots will end up dropping down the table.
Most of the top XI was fairly an easy pick. I should admit though that I am not completely satisfied with the selection. I am missing a sixth bowler. I find it strange to say this but I was tempted to put in Joe Root in the side because of his bowling!! I could not ignore the performances from Callum Macleod and Shaun Marsh. This is my playing XI for ODI.

My side bats until no. 9. This side can be lethal against any bowling attack. The bowling should be able to defend a score put up by the batsmen. As always I look forward to hearing your views.

One thought on “Cricket Portfolio Index ODI: Norm or Outliers?”