

August 27th was the birthday of the great Sir Donald Bradman. His test average of 99.94 is the holy grail of cricket. It would make sense to use Don Bradman as a benchmark for batting. His performance is beneath
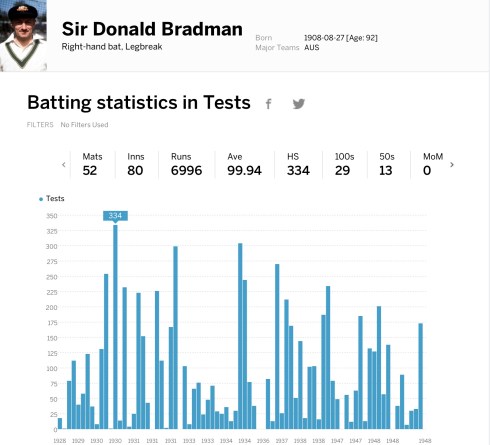
I ran his performances using my algorithm and his total is 9,628 and his batting score is 9,276. I worked through the numbers and I do not see any reason to adjust my weights and factors that I use for the players today. The problem though is how do I accurately compare Bradman’s performance to another player? Either I can admit the first 52 games of a player and forget about the remaining. That, though, would not be fair for players. Sachin Tendulkar took less than eight years to notch up 52 tests. He played for four more years than Bradman but played 148 Tests more. The difference between Tendulkar’s career average and his first 52 is four runs more.
Tendulkar’s performance is beneath
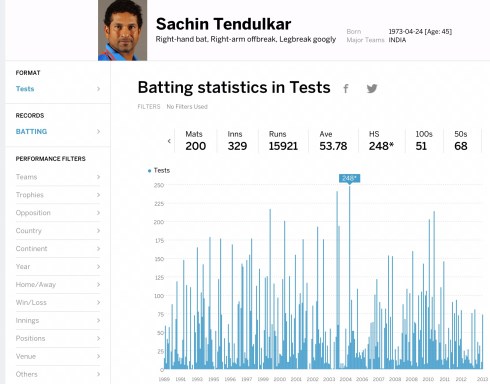
Based on my index Tendulkar scored 4,274 batting points and 4,726 total points in the first 52 games. However; Tendulkar’s has 19,265 batting points and 20,693 total levels.
I am open to ideas, but the only way I can think of levelling the playing field to annualise the scores. I set out this index coming from an investment point of view. Looking at the points scored and the innings played; Bradman’s batting points translates into 12.10% and Tendulkar into 3.65%. Don Bradman’s points can easily be broken by a good modern-day player, but the rate at which he got those points will be difficult to achieve and it is for this reason that the rate of scoring combined with the amount scored is important. To place things into perspective; if Tendulkar had to come close to Bradman’s rate of scoring points, then he would have had to get about Two Quadrillion points instead of 19,265!!! But to make things clear; Two Quadrillion is Two followed by 15 zeroes. 12.10% set by Don Bradman will be the Icarian dream just like his average of 99.94 runs is. The more realistic target would be 3.65% set by Sachin Tendulkar. The qualification would be 50 Tests or 75 innings, which is what I will be using for all batsmen as this is a good number for modern players as well as those who played in previous eras.

This graph represents the Tendulkar-Bradman Benchmark where the size of the bubble represents the points, the X-axis the innings played (as opposed to the games) and the Y-axis is the annualised points. I expect players to fall within this range. Adding the innings played to the points gives an additional dimension and context of the game. The test of a good benchmark is whether they can accurately place the performance of a player which is something I will be doing and I am confident that players, irrespective the era they played in will be accurately reflected in this graph.

One thought on “The Bradman-Tendulkar Benchmark”